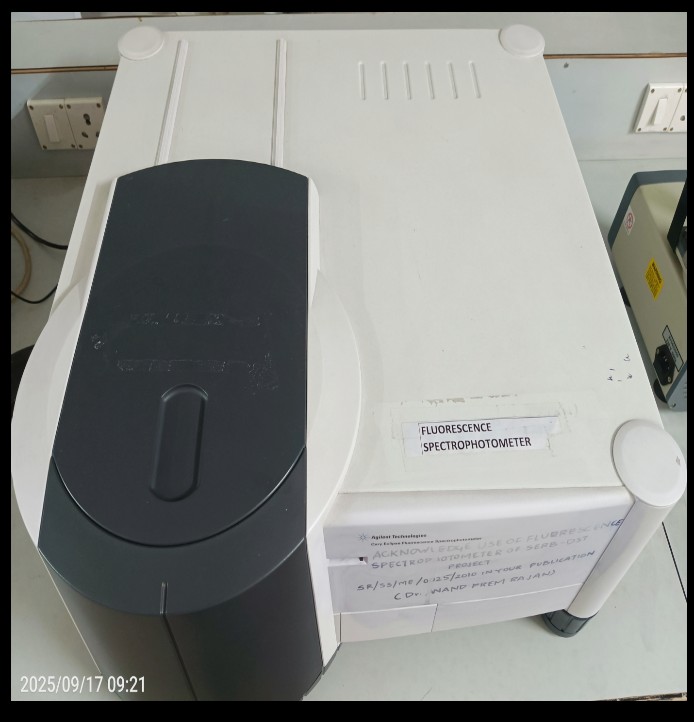
Make: Agilent
Model: Cary Eclipse

- Excitation:
A light source, often ultraviolet light, is directed at the sample. - Excitation State:
Molecules in the sample absorb photons of light and enter a higher energy "excited state". - Emission:
As the excited molecules return to their ground state, they release the absorbed energy by emitting a photon of light. This emitted light is the fluorescence. - Detection:
A fluorescence detector (a type of spectrofluorometer) measures the intensity and wavelengths of the emitted light. - Spectra:
The data collected can be plotted as:- Fluorescence Emission Spectrum: Shows the intensity of emitted light at different wavelengths for a fixed excitation wavelength.
- Fluorescence Excitation Spectrum: Shows fluorescence intensity at a specific emission wavelength across a range of excitation wavelengths.
- Excitation-Emission Matrix (EEM): A 2D plot of fluorescence intensity as a function of both excitation and emission wavelengths.
- Pharmaceuticals: Quality control and analysis of drugs.
- Biochemistry: Studying biological molecules and their environments.
- Environmental Science: Analyzing soil constituents and organic pollutants.
- Art Conservation: Non-invasively characterizing materials in artworks.
- Materials Science: Investigating optoelectronic materials and semiconductor devices.
Room No.: 113
SMV ( Hexagon Building)
School of Bio Sciences and Technology
SMV ( Hexagon Building)
School of Bio Sciences and Technology
Dr. Podili Koteswaraiah
School of Bio Sciences and Technology,
Vellore Institute of Technology - Vellore Campus,
Thiruvalam Road, Vellore, Tamil Nadu, India.
Landline: 0416-220 2556
Mobile: +91- 9840934792
Faculty In-charge E-mail ID:koteswaraiahpodili@vit.ac.in
Instrument email id:sbst.fspectro@vit.ac.in
School of Bio Sciences and Technology,
Vellore Institute of Technology - Vellore Campus,
Thiruvalam Road, Vellore, Tamil Nadu, India.
Landline: 0416-220 2556
Mobile: +91- 9840934792
Faculty In-charge E-mail ID:koteswaraiahpodili@vit.ac.in
Instrument email id:sbst.fspectro@vit.ac.in
| S. No. | Experiment Details | UG /PG Students from Academic Institutions (in INR) | Research Scholar from Academic Institution (in INR) | Project Staff from Academic Institution (in INR) | Faculty Members from Academic Institutions (in INR) | Research Scientist from R&D Organizations (in INR) | Industry Personnel from Industry (in INR) |
|---|---|---|---|---|---|---|---|
| 1 | Per Sample | 500 | 500 | 500 | 500 | 500 | 500 |